Attribution:
© Google 2025
Source

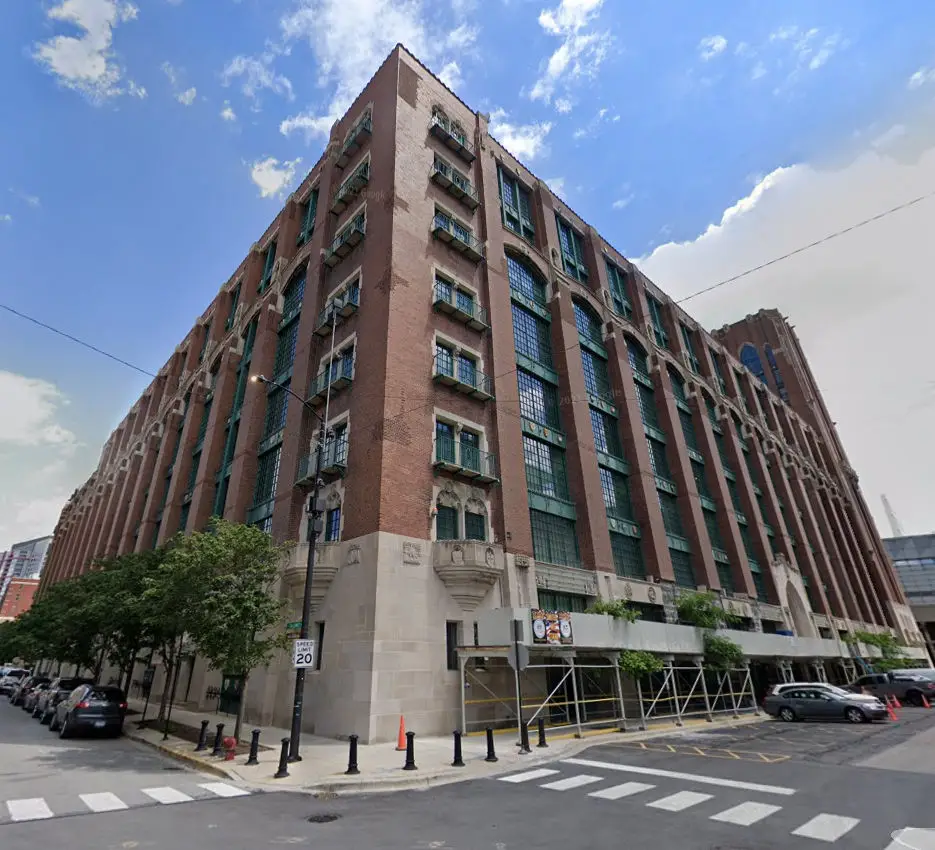
Building Info
- Square Footage
- 1,279,228 sqft10x median125,000 sqft8x median Data Center160,000 sqft
- Built
- 1912
- Primary Property Type
- Data Center
- Community Area
- Near South Side
- Ward
- 3
-
Chicago Energy Rating
- 1.0 / 4
-
Energy Star Score
- 1 / 100
- Owner
2022 Report Card
Debug Full Grade Data
- AvgPercentileLetterGrade:
- AvgPercentileGrade:
- GHGIntensityLetterGrade:
- GHGIntensityPercentileGrade:
- EnergyMixLetterGrade: A
- EnergyMixWeightedPctSum: 97.92619102923938
- EnergyMixPercentileGrade: 95.07334624965404
- SubmittedRecordsLetterGrade: A
- MissingRecordsCount: 0.0
- SubmittedRecordsPercentileGrade: 100.0
Emissions & Energy Information for 2022
- Greenhouse Gas Intensity
- Not Reported
This data was not reported for this building this year, which likely means a value of zero for this field.
- Total Greenhouse Gas Emissions
- Not Reported
This data was not reported for this building this year, which likely means a value of zero for this field.
Years Reported
2/4
A


2019
2020

2021
2022
Energy Breakdown for Digital Lakeside
- Fossil Gas Use (aka Natural Gas)
- 0 kBtuMedian Chicago Building5,531,309.9 kBtuMedian Data Center515,230 kBtu
- Electricity Use
- 1,114,458,041 kBtuEst. Electric Bill: $46,708,000 for 2022**309x median3,601,769.1 kBtu21x median Data Center52,447,370 kBtu
- District Steam Use
- 33,250,416 kBtu5x median6,360,617.1 kBtu
- District Chilled Water Use
- 455,641,579 kBtu64x median7,171,044.1 kBtu
Energy Mix A
Total Energy Use: 1,603,350,037 kBTU
Scan To Learn More
https://electrifychicago.net/building/101185
View Extra Technical & Historic Info
- Source Energy Usage Intensity
- Not Reported
This data was not reported for this building this year, which likely means a value of zero for this field.
- Site Energy Usage Intensity
- Not Reported
This data was not reported for this building this year, which likely means a value of zero for this field.
Full Historical Data Table for Digital Lakeside
| Year |
Overall Grade |
Emissions Intensity Sub-Grade |
Energy Mix Sub-Grade |
Reporting Mix Sub-Grade | GHG Intensity kg CO2e / sqft | GHG Emissions metric tons CO2e | Energy Mix | Electricity Use kBTU |
District Steam Use kBTU |
District Chilled Water Use kBTU | Source EUI kBTU / sqft | Floor Area sqft |
Chicago Energy Rating |
Energy Star Score |
|---|---|---|---|---|---|---|---|---|---|---|---|---|---|---|
| 2019 | C | F | A | A | 151.5 | 185,162 | 72%Electricity 0%Fossil Gas 0%Other | 992,328,338 | 834,714 | 376,223,342 | 2556.6 | 1,222,150 | 2.0 | 1.0 |
| 2020 | C | F | A | A | 142.1 | 173,705 | 73%Electricity 0%Fossil Gas 0%Other | 987,573,211 | 2,620,723 | 363,190,558 | 2538.5 | 1,262,150 | 1.0 | 1.0 |
| 2021 | - | 1,003,962,916 | 2,956,786 | 452,189,114 | 2606.8 | 1,279,228 | 1.0 | 1.0 | ||||||
| 2022 | - | 1,114,458,041 | 33,250,417 | 455,641,579 | 2887.6 | 1,279,228 | 1.0 | 1.0 |
* Note on Rankings: Rankings and medians are among included buildings, which are those who reported under the Chicago Energy Benchmarking Ordinance for the year 2023, which only applies to buildings over 50,000 square feet.
** Note on Bill Estimates:
Estimates for gas and electric bills are based on average electric and
gas retail prices for Chicago in 2021 and
are rounded. We expect large buildings would negotiate lower rates with
utilities, but these estimates serve as an upper bound of cost and help
understand the volume of energy a building is used by comparing it to
your own energy bills! See our
Chicago Gas & Electric Costs Source
for the original statistics.
Data Source:
Chicago Energy Benchmarking Data