Ward 17 Quick Stats
Grade Distribution
This page shows all buildings identified as being in Ward 17 that submitted building benchmarking data.
Learn more at
The City of Chicago - Ward 17

Note: Data From Large Buildings in 2023
Note: This data only includes buildings whose emissions
are reported under the
Chicago Energy Benchmarking Ordinance. According to the City “As of 2016, this list includes all
commercial, institutional, and residential buildings larger than 50,000
square feet.”
The latest year of data is from 2023, but we update the site regularly when new data is available, and some buildings may have failed to report that year, and only have older data available.
Additionally, note that all tons specified are metric tons.
| Name / Address | Primary Property Type | Square Footage |
GHG Intensity (kg CO2 eq./sqft) |
Total GHG Emissions (tons CO2 eq.) |
|---|---|---|---|---|
|
Continental Plaza
A
1330 W 76th Street
| Multifamily Housing | 203,603 sqft
Highest 32%
| 4.6 kg/sqft
Lowest 18%
| 945 tons
Highest 45%
|
|
Tarkington
(CPS)
B
3330 W 71st St
| K-12 School | 136,289 sqft
Highest 47%
| 6.4 kg/sqft
Highest 45%
| 878 tons
Highest 48%
|
|
McKay
(CPS)
C
6901 S Fairfield Ave
| K-12 School | 128,128 sqft
Highest 49%
| 8.0 kg/sqft
Highest 23%
| 1,031 tons
Highest 42%
|
|
HighSchool_LeoHS
B
7901 S Sangamon St
| K-12 School | 111,882 sqft
Lowest 45%
| 3.5 kg/sqft
Lowest 4%
| 391 tons
Lowest 17%
|
|
Barton
(CPS)
C
7650 S Wolcott Ave
| K-12 School | 82,203 sqft
Lowest 30%
| 6.7 kg/sqft
Highest 40%
| 547 tons
Lowest 32%
|
|
Joplin
(CPS)
C
7931 S Honore St
| K-12 School | 77,483 sqft
Lowest 26%
| 7.4 kg/sqft
Highest 30%
| 575 tons
Lowest 35%
|
|
St. Sabina Elders Village
C
1222 W. 79th Street
| Multifamily Housing | 77,400 sqft
Lowest 26%
| 6.0 kg/sqft
Lowest 47%
| 467 tons
Lowest 25%
|
|
Oglesby
(CPS)
B
7646 S Green St
| K-12 School | 77,140 sqft
Lowest 26%
| 4.8 kg/sqft
Lowest 22%
| 374 tons
Lowest 15%
|
|
StSabina_School
⚠️
C
7819 S Throop St
| K-12 School | 73,060 sqft
Lowest 24%
| 5.2 kg/sqft
Lowest 30%
| 376 tons
Lowest 15%
|
|
CICS Ralph Ellison
C
1817 W. 80th St.
| K-12 School | 69,000 sqft
Lowest 20%
| 6.7 kg/sqft
Highest 40%
| 466 tons
Lowest 25%
|
|
Stagg
(CPS)
C
7424 S Morgan St
| K-12 School | 68,227 sqft
Lowest 20%
| 5.5 kg/sqft
Lowest 36%
| 379 tons
Lowest 16%
|
|
Catholic Charities: St. Leo Residence
🕰️
C
7750 S Emerald Ave
| Multifamily Housing | 67,170 sqft | 8.4 kg/sqft | 554 tons |
|
70800552 -- Chicago
⚠️
D
7030 S Ashland Avenue
| Supermarket/Grocery Store | 63,284 sqft
Lowest 15%
| 31.0 kg/sqft #12 Highest
| 1,963 tons
Highest 22%
|
|
250-Senior Suites of Auburn Gresham
C
1050 W. 79th
| Senior Living Community | 60,500 sqft
Lowest 12%
| 7.5 kg/sqft
Highest 29%
| 454 tons
Lowest 23%
|
|
Southside HS
(CPS)
B
7342 S Hoyne Ave
| K-12 School | 54,740 sqft
Lowest 6%
| 6.4 kg/sqft
Highest 45%
| 350 tons
Lowest 13%
|
|
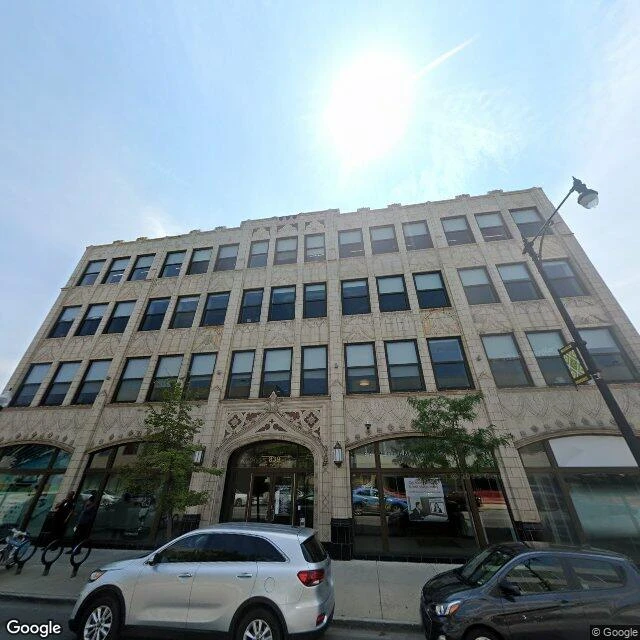
839 W. 79th
📷
⚡
C
839 W. 79th Street
| Office | 54,000 sqft
Lowest 5%
| 11.1 kg/sqft
Highest 9%
| 600 tons
Lowest 36%
|
|
Auburn Gresham Health and Wellness Center
⚠️
(CPS)
8131 S May St
| Health Care | - | - | - |
|
122 160 W 79th St
⚠️
122 160 W 79th St
| Commercial | - | - | - |
|
Hayes Manor Senior Apartments
⚠️
1211 W Marquette Rd
| Residential | - | - | - |
|
Anchor House
⚠️
1230 W 76th St
| Residential | - | - | - |
|
Randolph Elementary -CPS
⚠️
(CPS)
7316 S Hoyne Ave
| K-12 School | - | - | - |
|
Cuffe Math/Science/Tech Academy -CPS
⚠️
(CPS)
8324 S Racine Ave
| K-12 School | - | - | - |
|
Altgeld Elementary-CPS
⚠️
(CPS)
1340 W 71st St
| K-12 School | - | - | - |
|
Gresham Elementary -CPS
⚠️
(CPS)
8524 S Green St
| K-12 School | - | - | - |
|
Cook Elementary -CPS
⚠️
(CPS)
8150 S Bishop St
| K-12 School | - | - | - |
|
The Montessori School of Englewood
⚠️
(CPS)
6936 S Hermitage Ave
| K-12 School | - | - | - |
|
753 W 79th St
⚡
❌
753 W 79th St
| - | - | - |
Data Source:
Chicago Energy Benchmarking Data